| Excerpt |
|---|
Performance & StatisticsWhen your campaign is live, your ad is shown to the targeted audiences. In the campaign list you can see you original Budget, Amount delivered, Quantity, Impressions, Clicks and CTR (click-through-rate). 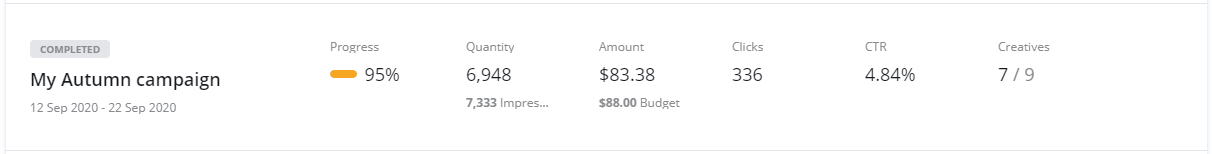 Statistics like how many times your ads are shown (impressions), clicks, views, completions, etc. are collected daily. The daily statistics are calculated into Performance charts which are updated continuously. Statistics are collected from creative level all the way up to totals for all your campaigns. Performance summaryOn your Dashboard > Performance summery you get an overview of total statistics for all your campaigns. Total ImpressionsHow many times your ads have been shown. 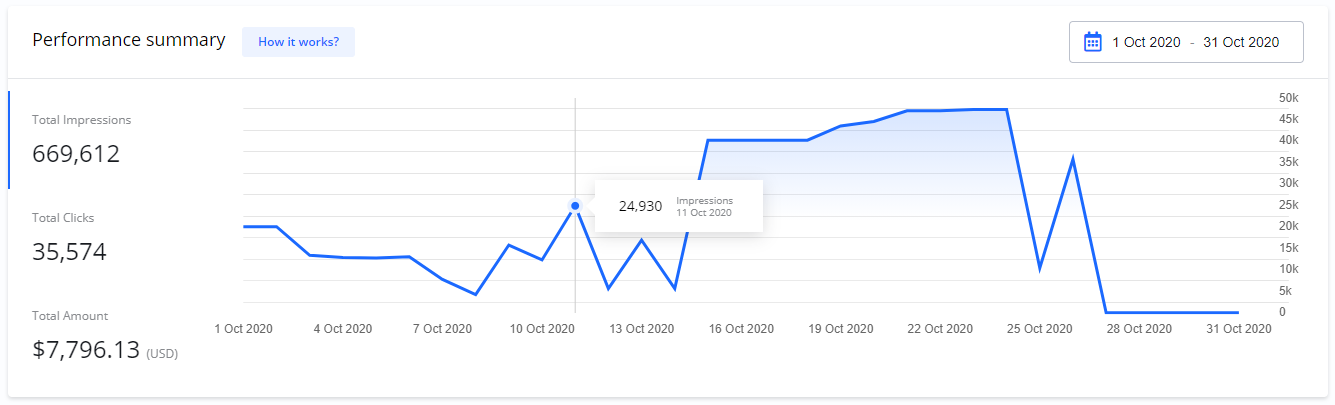 You can filter the chart on Start and End dates. 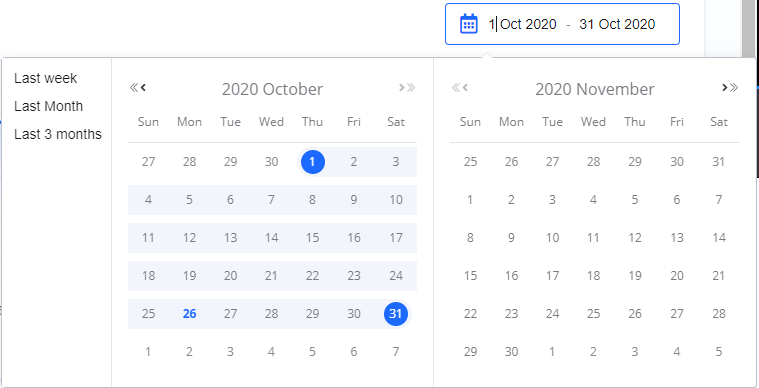 Hover If you move your mouse over the chart to you can see more detail:details. 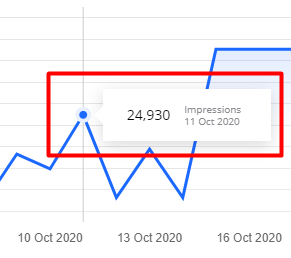 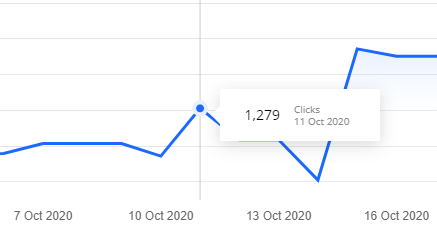 Total ClicksNumber of times people have clicked your ads. 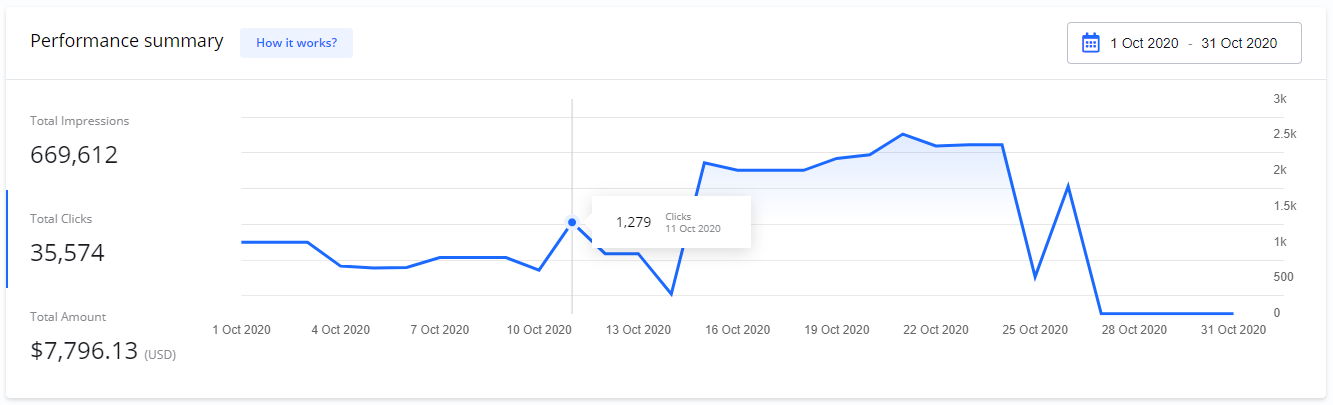 Total AmountTotal amount delivered. 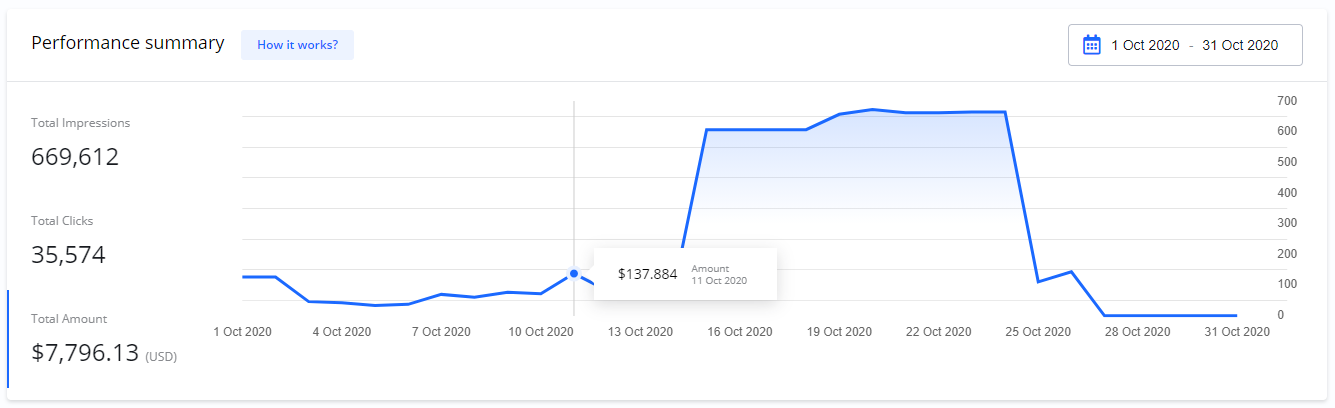 Campaign performanceOn Campaign details > Performance you find the statistics for each campaign. 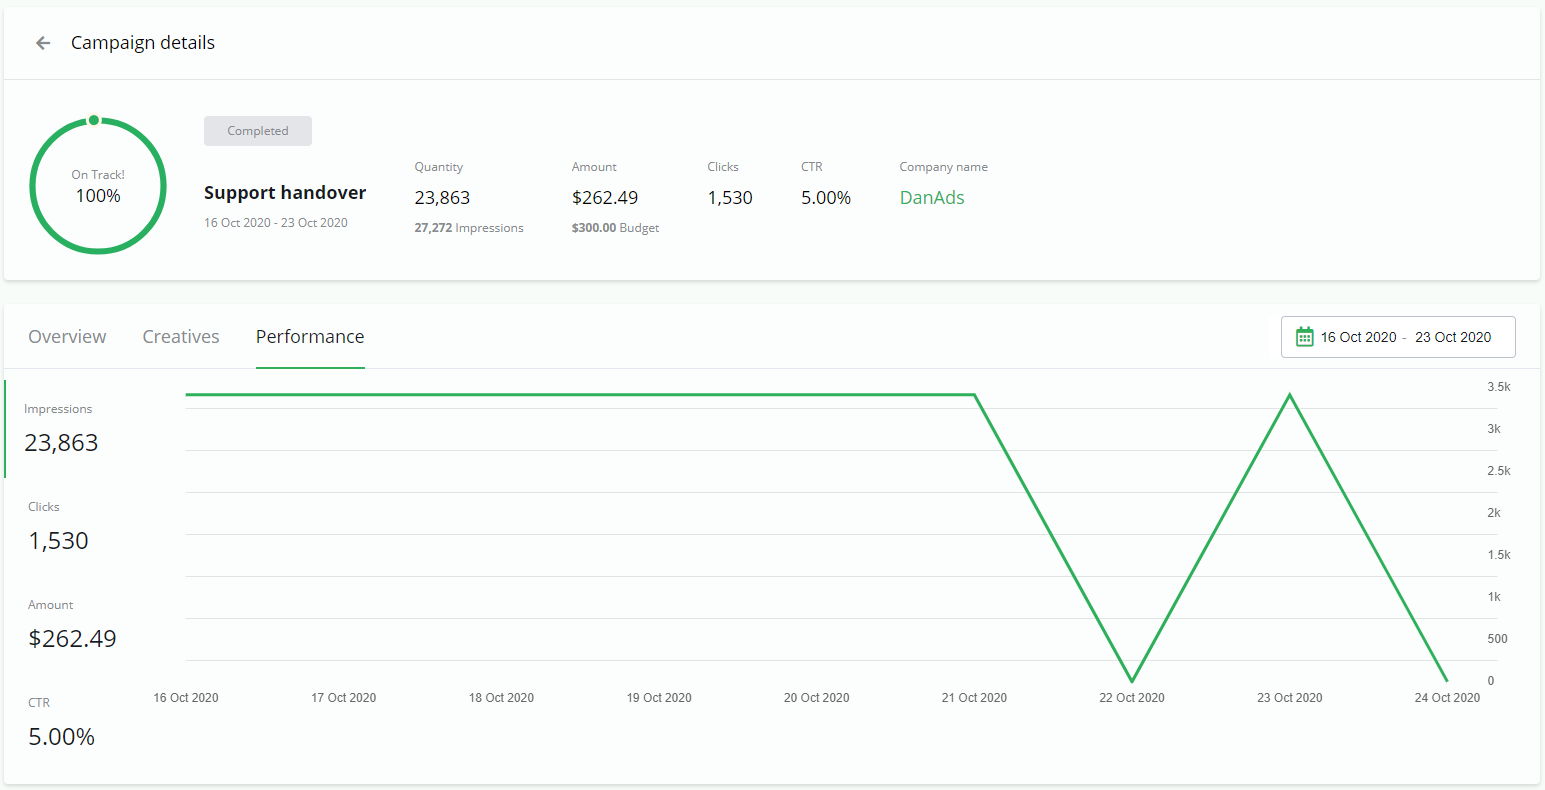 CTR - Click-Through-RateIn addition to Impressions, Clicks and Amount,the campaign details show you CTR (Click-Through-Rate). CTR is the percentage of all the people who saw your ad and clicked on it. CTR is calculated as Clicks/Impressions. 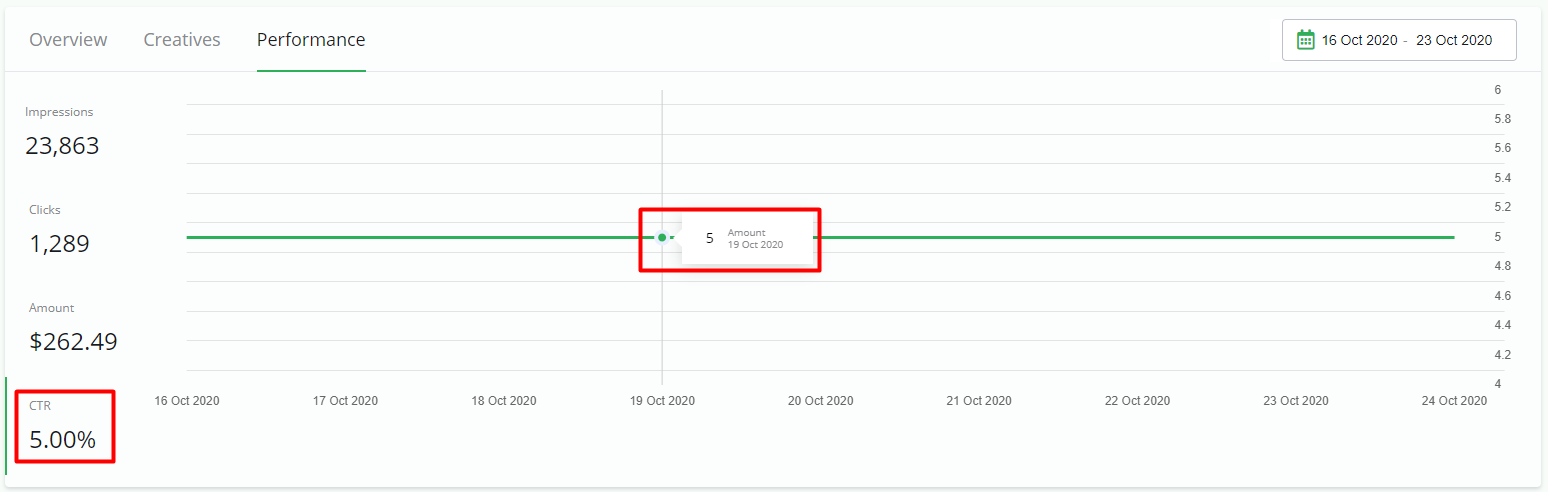 Creatives statisticsCampaign details > Creatives give you an overview of statistics per creative. 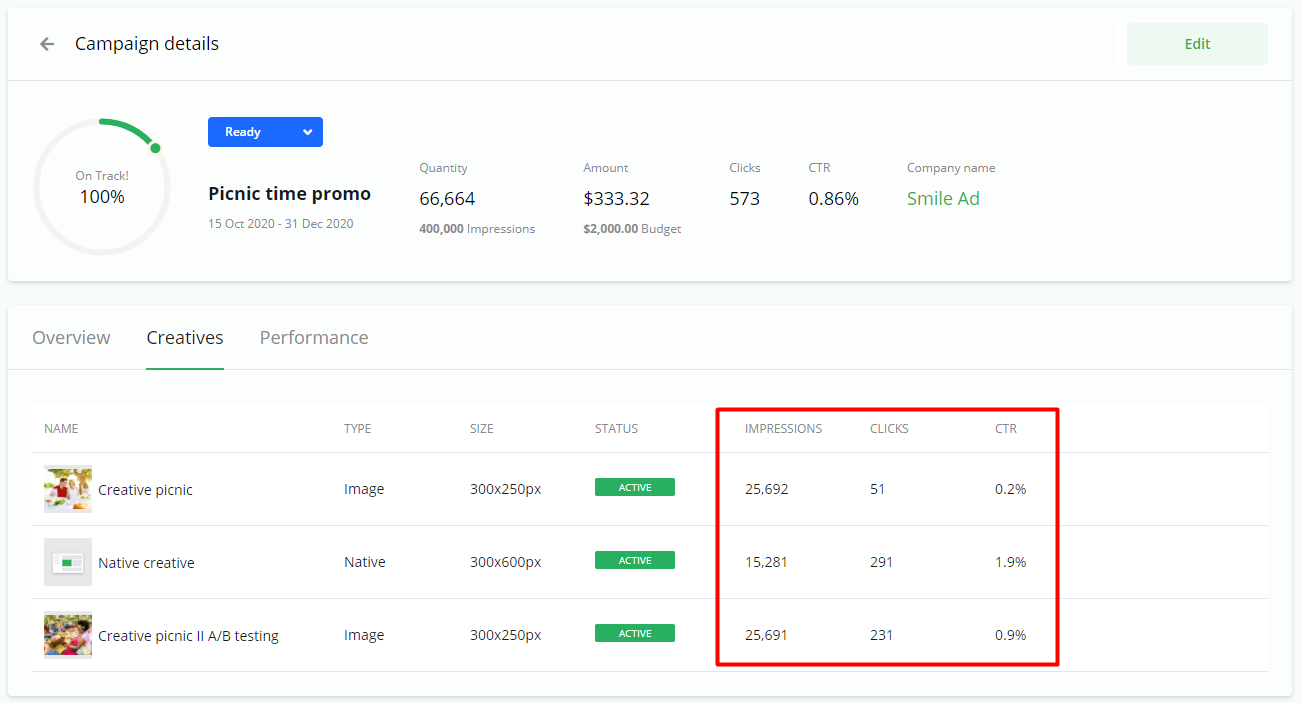 |
Page Comparison
Manage space
Manage content
Integrations
App links